Bulletin: Date/Time Granularity in Maps, Reports, Quick Charts, and Pivot Charts
This bulletin discusses how time increments are handled in EpiCenter’s Maps tab (e.g., maps and Quick Charts) and in the Reports tab (e.g., in custom report maps and related Pivot Charts).
Users typically select an increment of time (hour, day, week, or month) as the basis for their data analysis. To work with data from a given period, users select the end date they want and then specify an amount of time (in hours, days, weeks, or months) leading up to that date.
In the Maps Tab
For analyzing current data totaled by day, the Maps tab applies the current time of day by default, and defines each day as a 24-hour period ending at that time. The presumption is that the user wishes to see current analysis.
For analyzing historical data that is totaled by day, or for analyzing any data that is totaled by week or month, the Maps tab uses as its time frame the calendar day, week, or month containing the date keyed into the input selector.
A calendar week corresponds to an MMWR week, running from Sunday to Saturday. See https://wwwn.cdc.gov/nndss/document/MMWR_Week_overview.pdf for details.
A calendar month extends from 00:00 on the first day of the month to 23:59 on the last day of the month.
If the “Enable Hours” option is activated, the Maps tab’s input selector will accept hour specifications and apply them when totaling data by hour or day. When data is totaled by week or month, the system will accept hour specifications but will not apply them.
Supported Analysis Methods
- Exponential Moving Average Probability, Recursive Least Squares Probability, and Simple Moving Average Probability support data totaling by day only.
- Poisson supports data totaling by hour and day.
- Total Counts support data totaling by hour, day, week, and month.
In the Reports Tab
For analyzing current data totaled by day, Report maps permit users to specify a time in the input selector; a 24-hour period ending at that time constitutes one day. Hours and minutes may always be specified, and when totaling by day the specified time is always applied.
For analyzing historical data that is totaled by day, or for analyzing any data that is totaled by week or month, Report maps function just like those in the Maps tab.
Week and month definitions remain the same.
In effect, the “Enable Hours” functionality is built into Report maps, in that time specifications are allowed at all times. However, as in the Maps tab, time specifications are only applied when data is totaled by hour or day. When totaling by week or month, the system will accept time specifications but will not apply them.
Supported Analysis Methods
- Exponential Moving Average Probability, Recursive Least Squares Probability, Cumulative Sum – EMA Probability, Simple Moving Average Probability, and Poisson support data totaling only by day.
- Total Counts support data totaling by hour, day, week, and month.
In Quick Charts and Pivot Charts
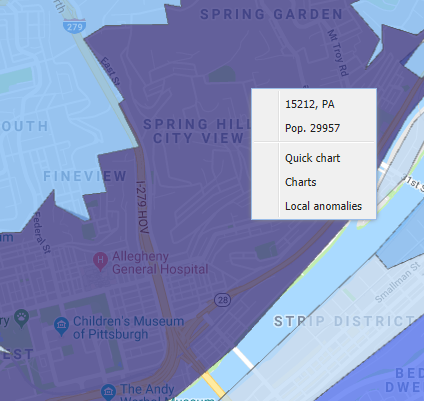
Added historical context is provided via the Quick Chart option.
Quick Charts depict data from a trailing window of at least 30 days. Accompanying the chart are case details for each patient.
A “Patient Details” option is also available from the Pivots submenu on Report maps. Users specify their desired time frame, which can be expressed in hours, days, weeks, or months.

